inReach message from Javi

Back and safe at basecamp — De regreso y a salvo en el campamento base

View the location or send a reply to Javi:
https://eur.explore.garmin.com/textmessage/txtmsg?extId=08db92c0-c835-8438-6045-bd7c9c1f0000&adr=cevo748yure%40post.wordpress.com

Javi sent this message from: Lat 46.84477 Lon -121.734052

Do not reply directly to this message.

This message was sent to you using the inReach two-way satellite communicator with GPS. To learn more, visit http://explore.garmin.com/inreach.

inReach message from Javi

I made it to the summit, woohoo!!! — Lo conseguí, estoy en la cumbre!!!

View the location or send a reply to Javi:
https://eur.explore.garmin.com/textmessage/txtmsg?extId=08db9299-db1d-d52e-000d-3aa7f4200000&adr=cevo748yure%40post.wordpress.com

Javi sent this message from: Lat 46.853299 Lon -121.759973

inReach message from Javi

Going for my summit push! Wish me luck — Voy atacando a la cumbre! Desearme suerte

View the location or send a reply to Javi:
https://eur.explore.garmin.com/textmessage/txtmsg?extId=08db925b-4f58-2bd8-6045-bd2d48110000&adr=cevo748yure%40post.wordpress.com

Javi sent this message from: Lat 46.844802 Lon -121.734052

inReach message from Javi

Ready for my summit push! — Preparado para mi ataque a la cumbre!

View the location or send a reply to Javi:
https://eur.explore.garmin.com/textmessage/txtmsg?extId=08db923d-86b8-2a5d-6045-bd7c9c1f0000&adr=cevo748yure%40post.wordpress.com

Javi sent this message from: Lat 46.844748 Lon -121.734052

Glacier Travel and Crevasse Rescue

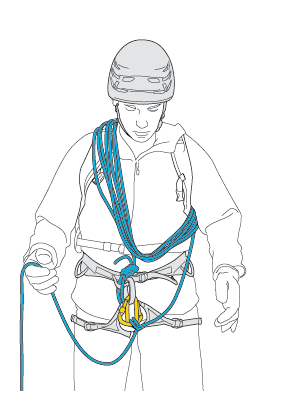
Three types of tie-in with or without chest coils.

1. With blocked chest coils

For even terrain requiring little variation in spacing of the team members.

Advantages:

  • Coils are stabilized, comfortable.
  • Tie-in at end of rope.

Disadvantages:

  • Rope adjustments difficult.

068w0000001OtYdAAK

Tie-in on carabiner with figure-eight knot

Advantages:

  • Reliable over time if knot is properly tied.

Disadvantages:

  • Long to untie if knot is tightened by a fall.
  • Use a directional carabiner or two reversed locking carabiners.

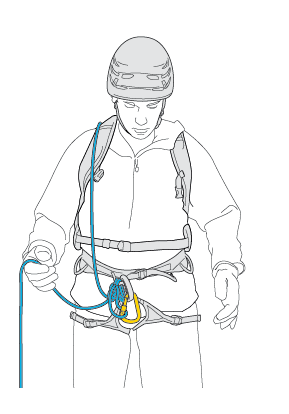
2. With unblocked chest coils

For terrain requiring frequent adaptation in spacing of the team members.

Advantages:

  • Quick rope adjustments.
  • Tie-in at end of rope.

Disadvantages:

  • The coils can become undone.

068w0000001OtYiAAK

Tie-in on carabiner with a clove hitch

Advantages:

  • Quick adjustments.
  • Knot is easy to untie even when tightened by a fall.

Disadvantages:

  • Use a directional carabiner or two reversed locking carabiners.

3. Reserve rope in bag, no chest coils

Set configuration for long walks.

Advantages:

  • Comfortable to carry.

Disadvantages:

  • Tie-in at end of rope is redone in case of emergency.

068w0000001OtYnAAK

Tie-in to harness with a bowline knot

Advantages:

  • Stays in place.
  • Unties well, even when well-tightened.

Disadvantages:

  • The loop must be secured with a carabiner.


From <https://www.petzl.com/INT/en/Sport/Three-types-of-tie-in-with-or-without-chest-coils-?ActivityName=Mountaineering>


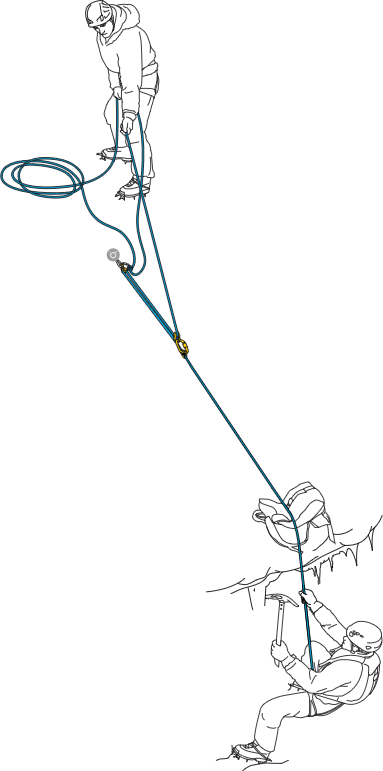
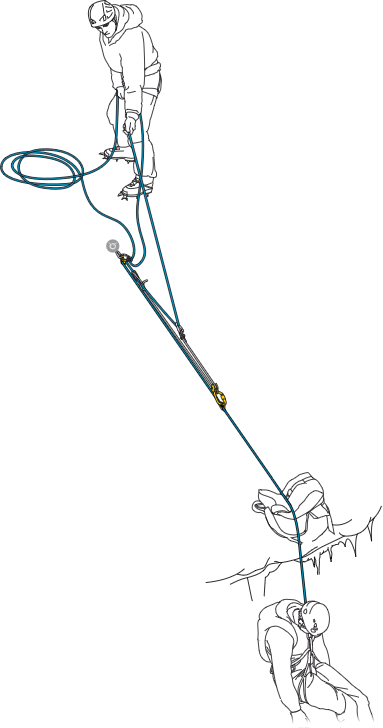
Approaching a glacier as a roped team of two

A crevasse fall is one of the major risks when approaching a glacier. Carrying hauling equipment and knowing hauling techniques is an essential precaution. But in the case of a crevasse fall, you must first stop your partner’s fall without falling in yourself. With a team of two, one climber alone will have to be the counterweight. It is thus important to start with the odds on your side…

Tie-in distance

The two climbers tie in at each end of the rope.

The tie-in distance is then adjusted with their tied off chest coils.

In case of a fall, the belayer often needs to move forward to withstand the first impact, then again to slow movement and completely arrest the fall. The length of the rope between the belayer and the crevasse allows this displacement.

The tie-in distance not only allows having just one team member exposed to the crevasse, but also to have enough space for a fall-arrest maneuver.

Each team member must keep enough rope for setting up a hauling system.

Untitled picture

Knots to facilitate braking

The rope cutting through the lip of the crevasse is a significant factor in braking a fall.

Arresting a fall on a bare ice lip is very difficult.

On a snow lip, the presence of knots in the rope is a valuable braking aid.

Untitled picture

Tie knots every 2 m along the rope (figure eight, overhand, butterfly…).

Untitled picture

Note: the knots in the rope make the hauling system more complicated to set up after a crevasse fall.

Two options:

• Solution 1: set up a hauling system on a knotted rope (see Crevasse falls: hauling on a knotted rope).

• Solution 2: you have enough extra rope to set up a hauling system without knots on the free end of the rope sent down to the victim (for example, you can have this amount of extra rope by having joined two 50-60 m ropes).

Keep the rope taut

The team members synchronize their progression in order to keep the rope taut without holding looped rope in their hands. If the rope is slack, the victim will fall faster, his partner will not be able to stop the fall, and risks being pulled into the crevasse himself.

Untitled picture

Untitled picture

Untitled picture

Untitled picture

Untitled picture

From <https://www.petzl.com/INT/en/Sport/Approaching-a-glacier-as-a-roped-team-of-two?ActivityName=Mountaineering>


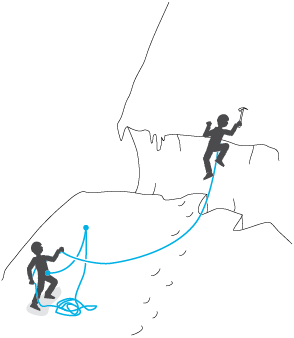
Crossing a bergschrund on a snow slope

While traveling an easy section, an occasional technically difficult part, like crossing a bergschrund, is often complicated to protect.

The specifics of the area may offer several options:

– crossing and taking the risk of no protection

– crossing with partial protection when possible

– turning back or finding another way

The leader takes the most risk, as generally there is no chance of placing intermediate protection.

Belaying the leader

If the greatest risk is falling into the bergschrund, the counter-weight of the second, farther back, may be enough.

If the risk is falling down the slope, a belay point must protect the party.

The second stays back, away from the line of a fall.

The leader’s rope does not go through the belay point, as it would be torn out in case of a fall.

The second effects a dynamic belay while anchored into the deadman.

068w0000001aqZeAAI

Warning: the leader will fall below his belayer without a directional anchor. VERSO and REVERSO cannot be used in this case. The second can belay from his harness with a Munter hitch or using a body belay.

Belaying the second

The leader can reach an existing anchor point or create a temporary one in the slope.

The second is belayed with a Munter hitch or a REVERSO on the anchor.

Caution: belaying from the harness with a directional point on the anchor doubles the load on the deadman because of the pulley effect.

068w0000001aqarAAA

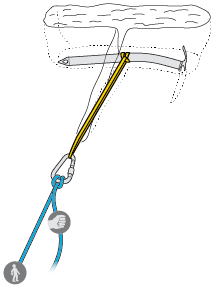
Examples of temporary anchors

Ice axe used as a deadman

068w0000001aqb1AAA

Sling around a rock horn

068w0000001aqbGAAQ

Two triangulated ice screws​

068w0000001aqejAAA

Caution: when planted vertically, the ice axe may help support one person, but is not a belay point and carries a high risk of coming out.​

068w0000001aqeoAAA

From <https://www.petzl.com/INT/en/Sport/Crossing-a-bergschrund-on-a-snow-slope?ActivityName=Mountaineering>


Rescue

Crevasse rescue no. 1: transferring the victim’s weight to an anchor

Once the fall has been arrested, the person on the surface holds the victim by acting as a counterweight. Rapidly creating an anchor allows unloading of the victim’s weight to organize the rescue.

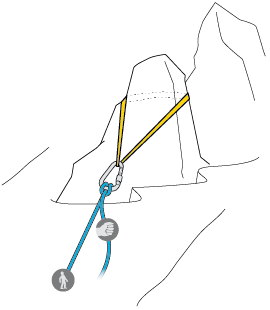
1. Creating a reliable anchor: ice axe or ski buried in the snow, or an ice screw in the ice. Connecting a sling to the anchor while respecting the direction of pull towards the victim.

068w0000001OyzuAAC

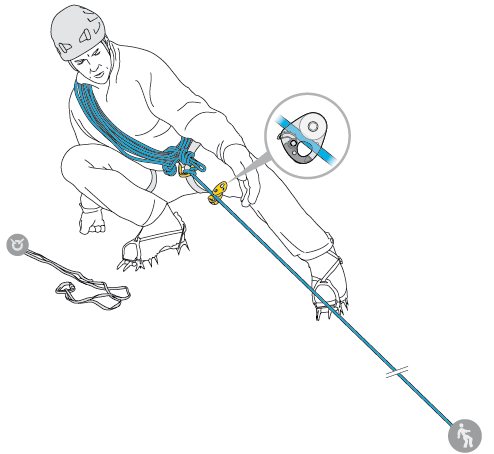
2. Install the MICRO TRAXION on the rope in the direction of hauling: it locks when pulled toward the anchor, and slides when pulled toward the victim.

068w0000001Oz04AAC

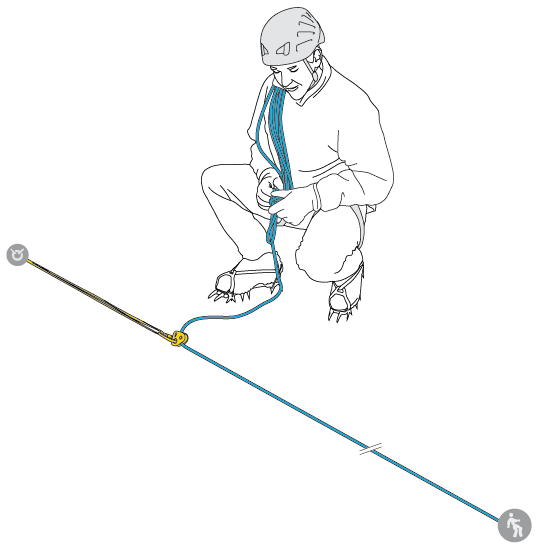
3. Connect the MICRO TRAXION to the anchor sling with a symmetrical locking carabiner (ATTACHE 3D). Extend the sling to its maximum length while sliding the MICRO TRAXION on the rope toward the victim.

068w0000001Oz09AAC

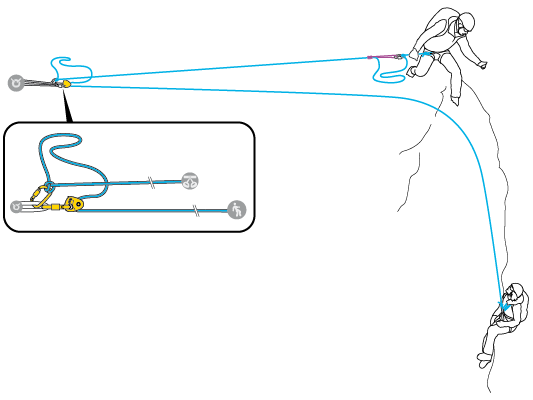
4. Gently release the tension of the rope on the harness to transfer the load to the MICRO TRAXION. Be careful to avoid jerky movements at this time, which would weaken the anchor.

Verify that the anchor is holding well under load. Untie the knot securing the chest loops, while remaining tied into the end of the rope.

068w0000001Oz0JAAS

5. The victim is now held only by the anchor; the rescuer is able to move freely.

From <https://www.petzl.com/INT/en/Sport/Crevasse-rescue-no–1–transferring-the-victim-s-weight-to-an-anchor?ActivityName=Mountaineering>


Crevasse rescue no. 2: accessing the edge of the crevasse to evaluate the situation

Once the fall has been arrested and the victim’s weight transferred to the anchor, it is necessary to access the edge of the crevasse to assess the victim’s condition before starting the haul.

The person on the surface, the “rescuer”, must always be anchored. If creating a second anchor is not possible, the rescuer can use the same anchor as the victim. The rescuer’s movements must be done with the rope under tension to avoid a shock load in case of a fall, which could weaken the anchor.

Moving with an autoblock knot on the victim’s rope

If the “rescuer side” of the rope is too short, it is possible to move with the autoblock on the taut rope supporting the victim. The rescuer must tie-in again as soon as possible after returning to the anchor.

068w0000001Oz0TAAS

Warning: in this case, if the rescuer falls, for example if the crevasse lip collapses, both climbers will be held by the same rope. The stresses on the system will be significant (anchor + progress capture pulley).

– The anchor could fail, causing both climbers to fall

– If the anchor holds, the rope could be damaged or cut by the MICRO TRAXION’s cam, especially if the rope is thin (See test results at the end of this document)

Moving with an autoblock knot on the rescuer’s rope

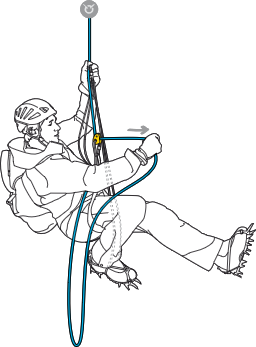
The autoblock allows the length of the rescuer’s belay rope to be constantly adjusted, without needing to untie from the rope.

068w0000001Oz0YAAS

From <https://www.petzl.com/INT/en/Sport/Crevasse-rescue-no–2–accessing-the-edge-of-the-crevasse-to-evaluate-the-situation?ActivityName=Mountaineering>


Crevasse rescue no. 3: haul systems for crevasse rescue

Many types of haul systems exist; some are more suited to various situations than others.

Here are three classic haul systems that can be done independently with minimal equipment. As with all rescue situations, training and prior knowledge of the techniques to use, are the best guarantee of success.

Simple haul system

Theoretical efficiency: 3 to 1 (victim weight divided by 3)

Advantages: minimal equipment necessary. Rapid, simple installation. Easy transition to a higher-efficiency haul system.

Disadvantages: average efficiency.

Suitable situation: victim who is capable of helping with his own ascent by using the wall.

Lightweight victim who the rescuer can easily haul.

Untitled picture

WARNING:

For the entire duration of hauling maneuvers, the rope between the anchor and the victim must remain taut to limit the risk of shock loading. If the victim is active, for example when crossing the lip, the slack rope must be continuously taken up.

Double Mariner

Theoretical efficiency: 7 to 1 (victim weight divided by 7).

Advantages: efficient hauling with reduced equipment.

Disadvantages: complex installation, training and memorization required. Requires a 5 m cord. A lot of rope to take up.

Suitable situation: victim unable to help, edge friction, heavy victim and lightweight rescuer…

Untitled picture

WARNING:

For the entire duration of hauling maneuvers, the rope between the anchor and the victim must remain taut to limit the risk of shock loading.

Loop haul

Theoretical efficiency: 2 to 1 (victim weight divided by 2).

Advantages: the victim participates fully in the haul effort.

Disadvantages: risk of jamming due to rope getting crossed while sending the pulley to the victim. Requires a lot of rope.

Suitable situation: rope team of two, tied-in mid-rope with the ends free and reserve rope stored in the packs. Victim capable of helping in the haul, but without support against the wall (overhanging crevasse, loss of ice axe…).

Untitled picture

WARNING:

For the entire duration of hauling maneuvers, the rope between the anchor and the victim must remain taut to limit the risk of shock loading.

If the victim is active, for example when crossing the lip, the slack rope must be continuously taken up to limit the risk of shock loading.

From <https://www.petzl.com/INT/en/Sport/Crevasse-rescue-no–3–haul-systems-for-crevasse-rescue?ActivityName=Mountaineering>

Ascending the rope in self-rescue: take care when approaching the anchor

When ascending rope, it is common to climb the wall instead of the rope when approaching the anchor.

At this moment, even if it is possible to make some climbing moves, the rope must always remain taut between the anchor and the ascenders to limit the potential fall distance.

If the climber neglects taking up slack, just a single step can significantly increase the fall factor. The consequences of a slip can be severe, as arriving at the anchor is a time when the climber feels more or less “out of the woods.”

Untitled picture

From <https://www.petzl.com/INT/en/Sport/Ascending-the-rope-in-self-rescue–take-care-when-approaching-the-anchor?ActivityName=Mountaineering>

Crevasse fall: hauling on a rope with knots

Tying knots into the rope is valuable in helping to brake a fall into a crevasse when there are only two team members tied in. In case of a fall, and without a second rope available, the victim must be hauled up on a rope tied with knots, which can not pass through a rope clamp at the head of the system. The method for untying the knots requires little additional equipment.

Warnings

  • Read the technical notice before viewing the following techniques.
  • It is important to fully understand the information provided in the technical notice before using this complementary information
  • Mastering these techniques requires training.
  • Consult a professional before attempting to perform these techniques on your own.

Transferring the load to the rope clamp below

The load must be transferred temporarily onto the rope clamp below, which is connected to the anchor, in order to slacken the rope and untie the knot.

1. Once the hauling system is in place, raising the victim moves the knots toward the system.

068w0000001OvLXAA0

2. Move the TIBLOC-type rope clamp below the knot to the other side of the knot. The TIBLOC is not loaded and can simply be removed.

068w0000001OvLcAAK

3. With the weight still on the pulley, install a long sling (120 cm) onto the anchor and connect it to the TIBLOC. Push the TIBLOC downward until the sling is at maximum tension.

068w0000001OvLhAAK

4. Carry out a small pull on the system to briefly release the cam of the MICRO TRAXION. Allow the load to descend under tension onto the sling and TIBLOC.

068w0000001OvLmAAK

5. With the load on the TIBLOC, only the sling and the lower rope are taut. Untie the knot.

068w0000001OvLwAAK

6. After untying the knot, check that the MICRO TRAXION’s cam is engaged and continue normal hauling on the system. After the first movement, disconnect the sling from the TIBLOC, until the next knot.

068w0000001OvM1AAK

From <https://www.petzl.com/INT/en/Sport/Crevasse-fall–hauling-on-a-rope-with-knots?ActivityName=Mountaineering>

Understanding the weather in South Africa – Part 3

In this third part of Understanding the weather in South Africa blog post series we look at some of the most notable local winds around the world, with special attention to the Berg winds of the South western coasts of South Africa and Namibia.

We complete the blog post series by looking at some other local weather phenomena and its expected alteration by the evident climate change in South Africa.

The second part of these series can be found here

Winds of the world

clip_image001

Berg

Location: South western coasts of South Africa and Namibia

Etymology: Afrikaans berg meaning ‘mountain’

Description:

Winds which blow from inland mountains to the southern and western coasts of Namibia and South Africa.

These winds blow during the winter season and create unseasonably warm temperatures.

Bora

Location: The Adriatic regions of Italy, Slovenia, and Croatia

Etymology: From the Greek boreas meaning ‘north-wind’

Description:

A cold wind blowing on the north Adriatic coast and north Italian plains predominantly in winter and spring.

Chinook

Location: Rocky Mountains, Canada & USA

Etymology: Named after Native American tribe

Description:

A warm and dry west wind (a type of foehn) which occurs on the eastern side of the Rocky Mountains. Its arrival is usually sudden, with a consequent large temperature rise and rapid melting of snow.

Etesian

Location: Aegean Sea and Eastern Mediterranean

Etymology: From the Greek etos, meaning ‘yearly’

Description:

A Greek term for the winds which blow at times in summer (May to September) from a direction between north-east and north-west in the eastern Mediterranean, more especially in the Aegean Sea. The winds are termed ‘meltemi’ in Turkey.

Foehn effect

Location: European Alps

Etymology: Derived from Latin favonius meaning spring breezes

Description:

A warm dry wind that occurs to leeward of a range of mountains. While the name originated in the European Alps it is now used as a more general term for this type of wind worldwide.

Haboob

Location: Sudan

Etymology: From the Arabic habub meaning ‘blasting’

Description:

The name applies to a duststorm in the Sudan north of about 13° N. They occur from about May to September and are most frequent in the afternoon and evening.

Harmattan

Location: West Africa

Etymology: Possibly from haram meaning ‘forbidden thing’

Description:

A dry wind blowing from a north-east / easterly direction over north-west Africa. Being both dry and relatively cool, it forms a welcome relief from the steady damp heat of the tropics, and from its health-giving powers it is known locally as ‘the doctor’.

It carries with it from the desert great quantities of dust often in sufficient quantity to form a thick haze, which impedes navigation on the rivers.

Khamsin

Location: Egypt and the Red Sea

Etymology: From the Arabic khamsin meaning ‘fifty’

Description:

A southerly wind blowing over Egypt in front of depressions passing eastwards along the Mediterranean or north Africa, while pressure is high to the east of the Nile.

Because this wind blows from the interior of the continent it is hot and dry, and often carries much dust. It is named referring to the fifty days it was said to blow, most frequently from April to June.

Levant

Location: Spain, South France and Gibraltar

Etymology: From the French levant meaning ‘rising’

Description:

A humid easterly wind which passes through the Strait of Gibraltar. It is most frequent from June to October, but may occur in any month.

Leveche

Location: South east Spain

Etymology: Unknown

Description:

A hot, dry, southerly wind which blows on the south-east coast of Spain in front of an advancing depression. It frequently carries much dust and sand, and its approach is indicated by a strip of brownish cloud on the southern horizon.

Mistral

Location: Southern France

Etymology: From the latin magistralis meaning ‘master wind’

Description

A north-westerly or northerly wind which blows offshore along the north coast of the Mediterranean from the Delta del Ebro to Genoa. In the region of its chief development its characteristics are its frequency, its strength and its dry coldness.

It is most intense on the coasts of Languedoc and Provence, especially in and off the Rhône delta.

Scirocco

Location: North Africa and Mediterranean

Etymology: From the Greek name Sirokos meaning ‘east’

Description:

A warm, southerly wind in the Mediterranean region. Near the north coast of Africa the wind is hot and dry and often carries much dust. After crossing the Mediterranean, the scirocco reaches the European coast as a moist wind and is often associated with low stratus clouds.

It is a blanket terms that encompasses many local winds including Ghibli (Libya), Chili (Tunisia) and Khamsin (Egypt).

Berg Winds of South Africa

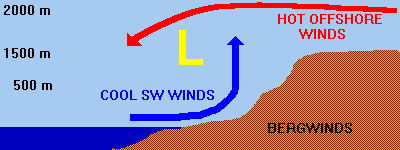
Bergwind is the South African name for a katabatic wind or mountain wind. In Afrikaans language “berg” means mountain. It is a hot, dry wind that blows down the Great Escarpment from the high central plateau in the interior of South Africa to the coast. Most people find it rather unpleasant. It can be mild at times blowing at about 10km/h, but sometimes it can be really strong and may gust up to 100km/h.

clip_image001

The Southern African Central Plateau edged by the Great Escarpment.

When the air that has been heated on the extensive central plateau flows down the escarpment to the coast it undergoes further warming by adiabatic processes. This accounts for the hot and dry properties of these off-shore winds, wherever they occur along South Africa’s coastline.

Bergwinds usually occur when a strong high pressure exists south or south-east of the country and when a high pressure is also situated over the country. These conditions usually only occur in winter, but sometimes in summer too, hence bergwinds are mainly an autumn-winter-spring phenomenon.

Since air rotates anti-clockwise around a high pressure in the southern hemisphere, the wind direction to the north of the high pressure will be easterly or north-easterly, especially along the west coast of southern Africa. The bergwinds will usually start blowing along the Namibian coast and the first indication of bergwinds is a rise in temperature, sometimes this rise can be rapid. In the winter of 1985 in Cape Town, the temperature rose from 3°C at 07:00 in the morning to 27°C by 07:35 that SAME morning. This is not a common occurrence, but rather an extreme case.

Since air in a high pressure descends and warms up as it descends it stands to reason that the off-shore winds will be warm to hot and the temperature will usually rise about 10 degrees Centigrade from the interior of SA to the coast. So the temperature at Upington may be 20°C, while at Alexander Bay it may be over 30°C.

At the same time a coastal low (discussed in the next section) will develop along the coast. Off-shore flow ahead of the coastal low is usually easterly to north-easterly in direction along the west coast and north-westerly along the east coast.

clip_image002

The light blue lines indicate surface wind directions. The “H” indicates the position of a portion of the South Indian Ocean Anticyclone (high pressure system) and the “L” indicates the position of the coastal low.

Humidity is usually very low, sometimes as low as 5%, usually between 10-40%. The temperature vary from 25°C to 35°C in winter and over 40°C in summer. Behind the coastal low the wind is on-shore and usually north-westerly to south-westerly in direction. It is cool and moist and usually associated with fog.

The coastal low moves down the west coast and around the Cape Point and then up the east coast of South Africa until it fills up near Maputo in Mozambique. The bergwinds obviously follow the same pattern. The highest official temperature ever recorded in South Africa (51.5°C) was recorded one summer during a bergwind occurring along the Eastern Cape coastline.

The bergwinds are usually followed by a cold front in winter.

Coastal lows

Berg winds are usually accompanied by coastal lows. These coastal lows happen due to the configuration of the plateau, escarpment and coastal plain described in the previous section, and they are confined to the coastal areas, always below the escarpment.

They can arise almost anywhere along the coast, however they often first appear on the west coast, or even on the Namibian coast. Then they always propagate counter-clockwise along South Africa’s coastline at between 30–60 km/h, from the west coast southwards to the Cape Peninsula and then eastward along the south coast, and finally north-eastward along the KwaZulu-Natal coastline, to finally dissipate north of Durban, due to the divergence of the coastline from the plateau which disappears altogether in the vicinity of the Limpopo valley.

There is always a hot off-shore berg wind ahead of a coastal low, which can blow for several days or for only for a few hours. This is then followed by cool onshore winds which bring low cloud, fog or drizzle to the region, but may, on occasions, produce substantial precipitation when coupled to an approaching cold front

Coastal lows are a common feature of the coastal weather in South Africa with an average of about 5 lows of varying intensities passing through Port Elizabeth per month. They are shallow (not more than 1000–1500 m deep), mesoscale (medium-sized) systems that are generally not more than 100–200 km across, trapped on the coastal plain by the escarpment on the inland side, Coriolis effects on the oceanic side, and an inversion layer above.

In the south-west corner of the country the coastal lows are bounded on the inland side by the Cape Fold Mountains, which tend to have a higher elevation than the escarpment, and form an almost continuous 1000 km mountain barrier running parallel to the coast from the Cederberg, 300 km to the north of Cape Town, to Cape Hangklip on the east side of False Bay and then eastwards for 700 km to Port Elizabeth, where they diminish gradually and stop.

clip_image003

Berg wind blowing desert sand off the Namibian coast.

Coastal lows and Berg winds are initiated by the interaction of large scale weather systems such as the quasi-permanent South Atlantic and South Indian Ocean Anticyclones (high-pressure systems), the cold fronts that approach the subcontinent from the South Atlantic Ocean, as well as the pressure systems on the plateau, causing air that has been warmed on the plateau by 2–3 days of sunny weather to flow down the Great Escarpment on to the coastal plain either on the west or south coasts of the country (i.e. causing a berg wind).

clip_image004

The descending air warms up adiabatically, heating up the coastal plain, while, at the same time, causing an off-shore wind which blows the surface water away from the land to be replaced by cold water which wells up from the depths. This upwelling of cold subsurface water from the ocean increases the ocean-land temperature difference, causing an on-shore wind.

clip_image005

The on-shore airflow is strengthened by the fact that the berg wind is not only hot, but it is also “stretched” vertically due to the sudden lowering of the floor over which it moves below the escarpment. Its low density, therefore, lowers the atmospheric pressure on the coast. This low-pressure area caused by the berg wind draws the dense moist maritime air onshore to the right of the off-shore berg wind. Shear forces between these on- and off-shore winds on the right-hand side of the berg wind tend to cause clockwise (or cyclonic) rotation of the air in this region. In addition, on reaching the escarpment the maritime air curves to the right round the low-pressure zone due to Coriolis forces (in the southern hemisphere) accentuating the cyclonic circulation of the “coastal low”.

The entire system is capped by an inversion consisting of a layer of warm air that has moved horizontally off the plateau at the level of the upper edge of the escarpment. This inversion layer prevents the upwardly spiraling cyclonic air of the coastal low from rising above 1000–1500 m, thus preventing it from causing significant precipitation.

clip_image006

The weather associated with a coastal low

Along the south coast the passage of a coastal low is typically preceded by a north-easterly wind driven by the South Indian Ocean Anticyclone. The wind then backs quickly through northerly to north-westerly as its temperature rises. This is the berg wind phase of the coastal low. The wind then changes abruptly to a strong, cold, south or south-westerly wind (called a “buster” if the change in wind speed is greater than 35 km/h). The buster coincides with the passage of the pressure minimum. The onshore wind gradually diminishes in intensity during the course of about a day, and is associated with cloudy, misty or drizzly weather.

Because of the often abrupt changes in horizontal and vertical wind speeds and direction that can occur within these small weather systems they represent a significant hazard to aircraft on landing and taking off. During the climb-out and approach phases of flight, aircraft airspeed and height are near critical values, thus rendering the aircraft especially susceptible to the adverse effects of these wind shears.

The Atlantic cold fronts that move into and across the subcontinent, especially during the cooler months of the year, are frequently associated, the day before, by a coastal low that moves ahead of the front. Under these circumstances the southerly or south-westerly onshore wind of the coastal low gradually diminishes in intensity over the course of 12–20 hours, when it is replaced by a westerly wind (which may temporarily reach buster proportions) and a further drop in temperature accompanied by rain, indicative of the passage of the cold front. Thus, particularly in Cape Town, an obvious berg wind is generally regarded as a harbinger of cold, wet weather.

Other orographically trapped weather systems

Coastal lows are orographically trapped weather systems that also occur in other parts of the world, where there are mountain ranges between 1000 – 4000 km in length. Thus they occur along the coast of Chile, eastern Australia and the west coast of North America, as well as on the eastern side of the Appalachian mountains of the United States. In each of these cases the weather systems are trapped vertically by stable stratifications, and laterally by Coriolis effects against the mountains. However, only the South African and the South American coastal disturbances are “coastal lows”; the remainder are generally produced by coastal ridging

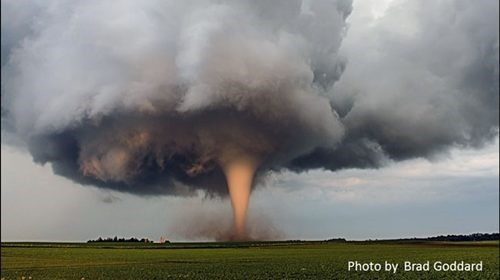
Tornados in South Africa

Extreme weather phenomena are on the increase in South Africa, with fierce storms, tornadoes and heatwaves hitting parts of KwaZulu-Natal, Gauteng and the Eastern Cape recently.

A few weeks after KZN was lashed by a series of tornadoes, the country reeled from a heatwave that recorded 53.2°C in Vioolsdrif in Namaqualand in the North West.

Tornadoes can occur basically anywhere where a thunderstorm is possible. From an analysis of the occurrence of South African tornadoes it became clear that most of them have been observed in Gauteng, the Free State, KwaZulu-Natal (along a line from Pietermaritzburg to Ladysmith) and the northern region of the former Transkei. In figure 1 the eastern part of the country is depicted, showing the more significant events (F2 and F3) from 1905 to 1997.

clip_image007

Some 65% of the South African tornadoes are classified as F0 or F1 (light damage), while more than 90% are classified as F0, F1 or F2 (considerable damage) or less. The tornado which occurred at Harrismith on 15 November 1998 was classified as F2 and the Mount Ayliff tornado which occurred in the Eastern Cape on 18 January 1999 was classified as F4.

Tornadoes can occur basically anywhere where a thunderstorm is possible. From an analysis of the occurrence of South African tornadoes it became clear that most of them have been observed in Gauteng, the Free State, KwaZulu-Natal (along a line from Pietermaritzburg to Ladysmith) and the northern region of the former Transkei. There seems to be a preference to mountainous areas.

clip_image008

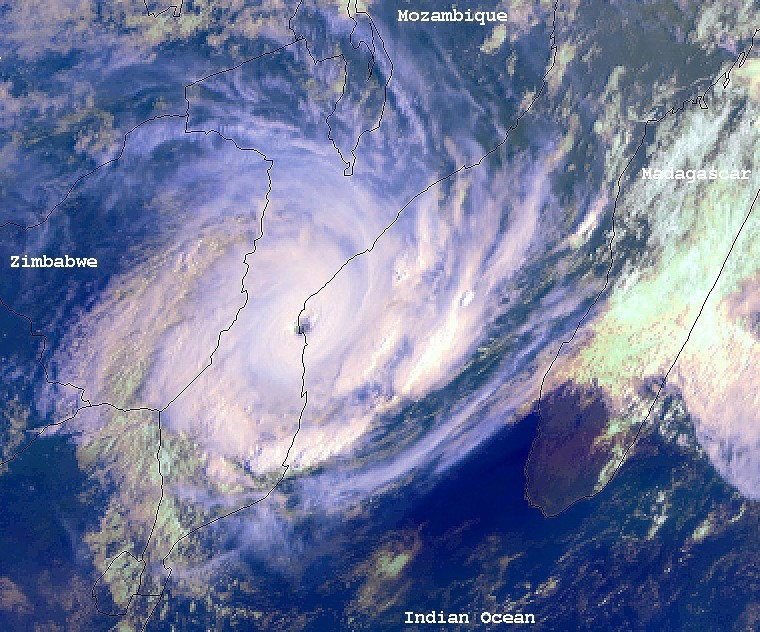
The effect of tropical cyclones on South Africa

The tropical cyclone season in our part of the world is from November to April, with the peak frequency in January and February. Only tropical cyclones moving into the Mozambique channel influence South Africa’s weather. When this happens, we usually experience dry weather over the interior because of the subsiding air surrounding a tropical cyclone. Only a few move in over or close enough to the land to cause destruction, and then usually north of the 25°S latitude. In such cases, the Northern Province, Mpumalanga and KwaZulu-Natal may experience destructive winds and the risk of flooding. Significant tropical cyclones that had such an effect on South Africa was Domoina which occurred in January 1984, Imboa in February 1984 and more recently Eline in February 2000.

clip_image009

Cyclone Leon–Eline was the longest-lived Indian Ocean tropical cyclone on record, traveling over 11,000 km during its 29‑day duration

Climate change in South Africa and its consequences on the weather patterns

Inter-annual and decadal climate variability and extreme weather events are natural phenomena. This means that South Africa from time to time experiences years that are unusually wet and cool compared to the long-term average.

At other times the country experiences relatively very dry and warm periods. This type of variability is part of the Earth’s natural climate dynamics and is partially caused by oscillations and complex configurations of global and regional climate systems working in concert to produce our weather.

Climate change is different from inter-annual climate variability. Climate change is a result of global warming which is caused by human activities that have resulted in the emission of various pollutants, principally carbon dioxide. This has altered Earth system dynamics in a way that affects the climate system, ultimately causing trends and changes to climate and weather systems.

Climate models project that, given the current rate of carbon dioxide emissions into the atmosphere, and some unique features of South Africa’s climate system, like our location in the subtropics and the important role that high pressure systems play in controlling the system, temperatures in southern Africa are likely to increase by at least 1.5 times the global average rate of temperature increase.

According to a National Climate Change Adaptation Strategy published by the Department of Environmental Affairs last year, there is evidence that extreme weather events in South Africa are increasing, with heat wave conditions found to be more likely, dry spell durations lengthening slightly, and rainfall intensity increasing.

Climate zones across the country are already shifting, ecosystems and landscapes are being degraded, veld fires are becoming more frequent, and overused natural terrestrial and marine systems are under stress.

As part of its report, the Department of Environmental Affairs provided a summary of projected future changes in temperature and rainfall in South Africa.

Before the end of the current century (to 2099) it expects temperature increases greater than 4°C across South Africa, with increases greater than 6°C possible in the western, central and northern interior.

There is more uncertainty around rainfall projections than in temperature projections. A large number of projections predict generally wetter conditions over the central and eastern interior while other projections predict generally drier conditions.


References

https://visibleearth.nasa.gov/

https://www.mindat.org/climate.php

https://en.climate-data.org/africa/south-africa-61/

http://koeppen-geiger.vu-wien.ac.at/

https://www.researchgate.net/publication/45714537

http://www.wasaproject.info/

http://veaonline.risoe.dk/wasa/

https://backend.orbit.dtu.dk/

http://citeseerx.ist.psu.edu/

https://www.sa-venues.com/no/weather.htm

https://www.windguru.cz/

https://www.metoffice.gov.uk/weather/

http://www.sajs.co.za

https://en.wikipedia.org/wiki/Berg_wind

Understanding the weather in South Africa – Part 2

The prevailing weather systems during different times of the year, with emphasis on the synoptic conditions which are conducive to the development of strong winds, are discussed in this second part of Understanding the weather in South Africa blog post series.

We will also look at the various Wind climatic zones in South Africa and the Numerical Wind Atlases (NWA) developed for the Wind Atlas for South Africa (WASA) project.

Finally we’ll examine the Weather, Research and Forecasting (WRF) model for South Africa and how the verification tasks performed for the WASA project have shown that the WRF-based NWA gives excellent results at 10 measurement mast locations distributed across different South African locations, making this numerical weather forecast model an excellent resource for paragliding pilots.

The first part of these series can be found here

Prevailing weather systems in South Africa and their influence on strong winds

The seasonal differences in the circulation features of the atmosphere, near the surface of southern Africa and the surrounding oceans, are mainly the result of the northward displacement of the subtropical high pressure belt by almost five degrees latitude from summer to winter. Usually these lower-level anticyclones on land are interrupted once to twice per week by cold-front troughs. Therefore the influences of the subtropical high-pressure belt and the mid-latitude westerlies with associated fronts vary significantly during the course of the year over the subcontinent.

The differences in the circulation features between the seasons, and hence the likelihood of strong winds due to particular circulation features, can be summarized with reference to Hurry and Van Heerden (1987), who gave a detailed overview of the seasonal differences in the atmospheric circulation over southern Africa.

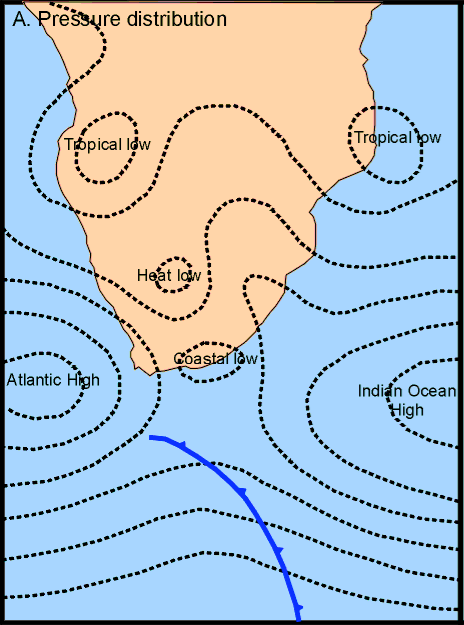
From the pressure distribution and basic movement of air masses, the following are noted with regards to the general synoptic circulation pattern in summer time:

clip_image001

The “Westerlies”, a band of strong westerly winds surrounding the globe in which extratropical low pressure systems develop, is situated well to the south of the continent. This implies that strong winds forthcoming from extratropical cyclones and their associated cold fronts will mostly be limited to the southern parts of the subcontinent.

The Indian Ocean high pressure system is situated more eastward, with frequent strong ridging over the subcontinent, where “ridging” refers to usually strong wind flow spiraling out from a high pressure system. The associated south-eastern Trades (A) influence the north-eastern part of the region. These winds can be strong, curving sometimes from Limpopo Province (L) into the Free State (F), or moving over far northern areas, such as Zimbabwe and Zambia (Z).

The moist air transported into the subcontinent can condense through uplift, e.g., from the topography or convection, with subsequent cloud formation and precipitation, often from thunderstorms which can produce strong wind gusts.

The Atlantic high pressure system, which is situated near the west coast, is a source of drier air which moves into the subcontinent from the southwest and southeast. The south-easterly wind blows mostly over the Cape Peninsula and is locally known as the “Cape Doctor”, due to its removal of pollutants in the air and possibly also because of the associated unpleasant dryness and gustiness. This wind can be quite persistent, as shown by an example of the growth in a north-westerly direction of some trees in this region (Sea Point, Cape Town)

The “moisture boundary” is the area where the moist air from the east and the drier air from the southwest meet. The air from the Indian Ocean tends to move over the Atlantic air, causing uplift and possible thunderstorms. When the moisture boundary is well to the south, widespread thunderstorms are possible.

Summer heating causes a heat low to develop in the west or northwest of the subcontinent. The south-eastern Trades from the Atlantic high pressure system (G) sometimes curve around this low, and change to the south-western Monsoon winds. Where these winds meet the south-eastern Trades the air masses converge to form the Congo air boundary, where thunderstorms are likely to develop.

The north-eastern Trades from the north-eastern Monsoon system cross the equator, and where they meet the south-eastern Trades, convergence takes place. This convergence area determines the position of the Intertropical Convergence Zone (ITCZ) where heavy rainfall with associated thunderstorms frequently occurs. Usually there is a shallow heat low over the Kalahari Desert, which sometimes influences the direction of the south-eastern Trades

clip_image002

Therefore, in conclusion to the above discussion, gust fronts from thunderstorm activity are frequent over most of the country in summer, but less so in the southern and western parts. The heating of the earth’s surface acts as a trigger for the development of thunderstorms, but additional factors play a role, such as orographic uplift, frontal uplift, and large-scale convergence ahead of a trough (an elongated area of relatively low atmospheric pressure) or east of a low-pressure cell. In addition, line storms can form parallel to trough lines and are associated with strong wind gusts ahead, typically referred to as “line squalls”.

From the basic pressure distribution and movement of air masses for winter, it is observed that all circulation features are situated more to the north than in summer. The southeastern trade winds still occur, but because the north-eastern Monsoon is absent, no convergence takes place. The ITCZ, as well as the Congo air boundary, move northwards and therefore the likelihood of thunderstorms to occur is diminished.

clip_image001[6]

The “westerlies” influence the weather of the southern and central parts of the subcontinent to a large degree. Therefore, cold fronts, with associated strong winds, often move over these areas and may reach far to the north. Strong winds and gusts during winter are usually caused by strong cold fronts, moving mostly over the southern half of South Africa, and also by the ridging of the high pressure systems behind the fronts. During this time of the year, gale force winds are frequently experienced over the Cape Peninsula, as well as the southern and south-eastern coasts.

When the Atlantic high pressure system moves more eastwards and stays strong, gale force winds can spread to the KwaZulu-Natal coast as far north as the Mozambique Channel. When the Atlantic high pressure system is situated south of the country, with the associated isobars lying almost parallel latitudinally, strong south-easterly to easterly winds can be experienced along the west coast.

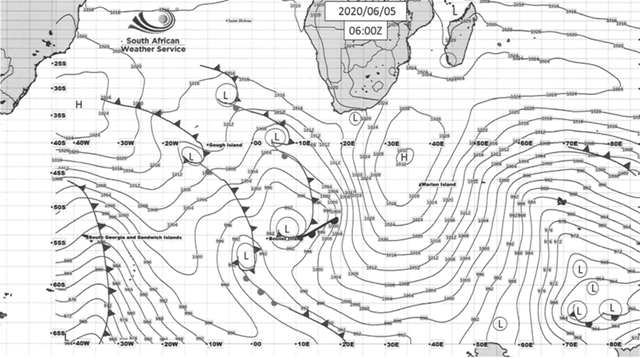
clip_image002

clip_image003

Synoptic charts for southern Africa for 15 July 2008 and June 5th 2020 representing the same exact conditions

In summary, South Africa’s prevailing winds are influenced by the large-scale weather patterns that have distinct characteristics between summer (left) and winter (right):

clip_image001[8]clip_image002[8]

Summer Circulation

  • The “westerlies” are situated well to the south of the continent.
  • The Indian Ocean and Atlantic Ocean high pressure systems are situated more southward.

Summer winds

  • The south-eastern Trades (A) influence the north-eastern part of the region. These winds can be strong, curving sometimes from Limpopo Province (N) into the Free State (F), or moving over far northern areas, such as Zimbabwe and Zambia (Z).
  • In the west, the S. E. Trades (B) caused by ridging of South Atlantic High, are often strong and persistent.
  • The strong westerlies are only able to influence the western, southern and south-eastern coastal areas and adjacent interior.

Winter Circulation

  • All circulation features are situated more to the north than in summer.
  • Strong winds and gusts during winter are usually caused by strong cold fronts, moving mostly over the southern half of South Africa, and also by the ridging of the high pressure systems behind the fronts.

Winter winds

  • The “westerlies” influence the weather of the southern and central parts of the subcontinent to a large degree. Cold fronts often move over these areas and may reach far to the north.
  • The strong westerlies are only able to influence the western, southern and south-eastern coastal areas and adjacent interior.
  • When the Atlantic high pressure system moves more eastwards and stays strong, gale force winds can spread to the KwaZulu-Natal coast as far north as the Mozambique Channel.

Wind climatic zones in South Africa and general analysis of the strong wind hazard

None of the aforementioned climatic regions consider the prevailing winds as an explicit factor in the delineation of different zones.

The only attempt to divide South Africa into strong wind regions was undertaken by Goliger and Retief (2002), who identified geographic zones where various types of strong wind events are likely to be dominant. The recorded lightning activity, specific documented extreme weather events, the “Lemon Technique” (which serves as an aid to weather forecasters), as well as the knowledge of the relevant SAWS experts were used as the input information.

The Institute of Structural Engineering at Stellenbosch University and the Council for Scientific and Industrial Research (CSIR) are currently involved in the process of developing a set of new generation building design codes for South Africa. The wind climatic information, which is currently incorporated in the design specifications, is based on the statistical analysis of medium/long-term records from a very limited number of wind recording stations, mainly located in large cities. The South African Weather Service (SAWS), together with the above-mentioned institutions are in the process of determining a comprehensive statistical description of strong wind speeds and directions for South Africa, which will be based mainly on the available data measured by the SAWS.

By analyzing the annual extreme wind gust data from 94 weather stations, which are spatially well distributed over the South African territory, it was possible to develop the climatology of strong wind zones for South Africa. A map of the strong wind climatic zones can be described as a basic diagram indicating the spheres of influence of specific weather systems that are likely to cause strong winds. Therefore, some resemblances between a general climate region and a wind climate region can be found as mean precipitation, temperature, humidity and other climate variables are also, to a large degree, determined by the prevailing weather systems.

clip_image001[10]

In this study the emphasis is on the weather systems which have the potential to cause very strong or extreme winds in a specific location, i.e., those climatic formations that are the usual causes of annual maximum wind gusts. In essence, we define a strong wind climatic zone in this study as a geographical area which indicates a type of weather system that has the potential to be the cause of an annual maximum wind gust.

clip_image002[10]

On a separate project, the National Disaster Management Centre (NDMC) approached the South African Weather Service (SAWS) to quantify a relative windstorm hazard component to form one of three components that would comprise the national indicative risk and vulnerability profile for wind storms in South Africa, in compliance with legislative requirements relating to generating indicative risk and vulnerability profiles.

The requirements of the project were firstly to define a windstorm hazard and retrospectively assess the conditions that meet these requirements from a historical perspective. Based on these findings, the outputs would encompass a spatial output of windstorm risk in South Africa. In addition, the seasonal quantification of the wind hazard should include the risks associated with likelihood, frequency, magnitude and predictability, as defined by the NDMC. Following the analyses of the four factors, an overall relative risk should be determined, which incorporates or considers the mentioned factors. A further requirement was that the wind hazard be quantified on at least a resolution at local municipal scale. There are in excess of 200 local municipalities, and the project should allocate a relative wind hazard quantity to each of these geographical areas. It was considered that the analyses of the measured data would in most cases reflect the risk to the largest part of the population (i.e. in the more urbanised areas) residing in a particular local municipality. From the outset of the project it was agreed that the quantification of the wind hazard would be based on the statistical analyses of measured data, of which SAWS is the official custodian in South Africa.

The following figure presents the likelihood of a wind hazard, defined by the occurrence of a gust equal or higher than 20 m/s per season.

In general, most of South Africa exhibits a high probability of at least one incident of a wind gust of 20 m/s or higher, except for the northern and northeastern parts during autumn and winter. This is mostly because of the diminished probability of strong thunderstorms occurring in the summer rainfall regions during those seasons. In the central and southern parts of the country, there is a likelihood for strong thunderstorms during the summer months, as well as strong winds from cold fronts during winter, when strong northwesterly winds often occur before the passage of a cold front.

clip_image003[8]

(a) Summer, (b) autumn, (c) winter, (d) spring

The next figure presents the frequency, defined as the estimated average number of days per season when the daily maximum wind gust is above 20 m/s.

During the summer months, the highest occurrences of strong wind gusts are estimated for the southwestern Cape, the Nelson Mandela metropole and the central Karoo, at 5 days or more per season. The northern and northeastern parts also show their highest frequency in summer because of strong thunderstorms, although only for about 1 or 2 days per season.

In autumn, the high frequencies in the southern and central regions are almost the same as in summer. However, in winter the Western Cape shows an increased frequency, resulting from the increased likelihood of strong frontal systems. This situation continues into spring, where the prevalence of strong southeasterlies increases over the southwestern parts. In the northern parts, the frequencies of strong wind gusts return to the summer situation.

clip_image004

The seasonal results of the overall relative wind hazard presented in the next figure show the following: A larger section of South Africa is subjected to very strong winds in summer and spring than during the other seasons of the year. In the south and southeast, the higher hazard categories are, as expected, more prevalent during winter and spring.

The central parts, e.g. central and southern Free State and northeastern Karoo experience high wind hazards during summer and spring, when strong northeasterly winds associated with troughs over the interior are prevalent, together with the increased likelihood of strong thunderstorms.

The northern and northeastern parts of the country show the same tendency toward higher wind hazards in summer and spring as in the central parts. However, the wind hazard in this region remains relatively low, with a highest category of 3 attained in some places during spring.

clip_image005

Wind data input from weather models

A general circulation model (GCM) is a type of climate model. It employs a mathematical model of the general circulation of a planetary atmosphere or ocean. These equations are the basis for computer programs used to simulate the Earth’s atmosphere or oceans. GCMs and global climate models are used for weather forecasting, understanding the climate, and forecasting climate change.

There are now many sources of “reanalysis” global wind data, where a weather model is re-run using all the data collated over the last 30-40 years to arrive at the data set.

This picture from the European Center for Medium Range Weather Forecasting (ECMWF) ERA Interim reanalysis, represents the annually averaged surface winds (10-meter Above Ground Level) across the world.

clip_image001[12]

A first segment of the ERA5 dataset is now available for public use (1979 to within 5 days of real time). ERA5 provides hourly estimates of a large number of atmospheric, land and oceanic climate variables. The data cover the Earth on a 30km grid and resolve the atmosphere using 137 levels from the surface up to a height of 80km. ERA5 includes information about uncertainties for all variables at reduced spatial and temporal resolutions.

ERA5 combines vast amounts of historical observations into global estimates using advanced modelling and data assimilation systems.

However, the general patterns shown by the GMC models do not capture regional phenomena that are at the meso scale.

clip_image002[12]

clip_image003[10]

clip_image004[7]

clip_image005[7]

Many countries around the World are running projects to downscale the data to be able to capture these effects.

The SAWEP and WASA project

The goal of the South African Wind Energy Program (SAWEP) is to reduce greenhouse gas emissions generated by thermal power in the national inter-connected system. SAWEP has six various expected outcomes including the implementation of a framework for wind energy, assessment of wind resources and promotion of commercial wind energy development. The wind resource assessment project is known as Wind Atlas for South Africa – WASA.

The main objective of WASA is to develop and employ numerical (modelled) wind atlas methods and to develop capacity to enable long term planning of large-scale exploitation of wind power in South Africa, including dedicated wind resource assessment and siting tools for planning purposes, i.e. verified with physical wind measurements numerical (modelled) wind atlas and database for South Africa.

Mesoscale models, which were develop for numerical weather prediction have since 1990’s increasingly been used, refined and validated in the calculation and development of numerical (modelled) wind atlases (Europe, Egypt, Canada, US, China, India, etc). It has been shown that by utilizing appropriate meso- and micro scale models, it is possible to calculate and develop wind atlases covering large geographical areas in much less time and cost as it extends the wind atlas beyond physical wind monitoring. However, physical wind monitoring is still required to verify the numerical wind atlas. The meso-scale model uses a variety of global, geophysical and meteorological databases such as the reanalysis database which is a gridded historical weather data set produced by the US National Centers for Environmental Prediction (NCEP) and Atmospheric Research (NCAR) to calculate regional wind atlases and presented in a numerical wind atlas.

Incorporating surface effects such as local topography, roughness, obstacles etc., called microscale modelling (high resolution), enables the estimation of the local wind climates and the identification of wind hot spot areas for wind farm planning, layout and wind resource assessment.

The WASA Phase 1 project covers the Western Cape province and parts of the Northern Cape and Eastern Cape provinces, and its main outcomes are:

  • Numerical Wind Atlas (NWA) and database for the modelled areas in the three provinces, including seasonal variations and resource maps prepared for introduction as GIS layer.
  • Micro scale resource map and database for 30-50% of the modelled areas
  • Map and database of extreme wind climate of the modelled areas

clip_image001[14]

The WASA Large-Scale High-Resolution Wind Resource Map available at http://www.wasaproject.info/ shows detailed information of the surface wind across South Africa such as mean surface wind speed that assists planners, wind farm developers and others to identify areas for wind exploration.

clip_image002[14]

What wind information does the atlas contain?

  • Wind speeds
  • Wind directions
  • Frequency of wind conditions

clip_image003[12]

A product of the WASA project: a wind resource map of Overstrand overlaid onto a Google Earth image


WRF Wind Forecast for South Africa

The Weather Research and Forecasting (WRF) model is a numerical weather forecast model designed to serve both operational forecasting and atmospheric research.

The two numerical wind atlases developed for the Wind Atlas for South Africa (WASA) project were created using the KAMM-WAsP method and from the output of climate-type simulations of the Weather, Research and Forecasting (WRF) model, respectively.

A document from the DTU Library available for download from orbit.dtu.dk compares the results from the Numerical Wind Atlases (NWA) produced by the KAMM-WAsP with that produced with the WRF method, and verifies the two wind atlases from the two methods against the observed wind atlas (OWA) generated from wind observations from the 10 WASA masts.

The KAMM-WAsP method was found to underestimate the generalized mean wind speeds at the sites (mean bias of 8.2% and mean absolute bias of 9.3%). In the WRF-based method there is, on average, a difference of 4.2% (either positive or negative) between the WRF-based NWA results and the corresponding observed values.

WM05 Observed wind atlas

clip_image001[18]

WRF-based NWA

clip_image002[18]

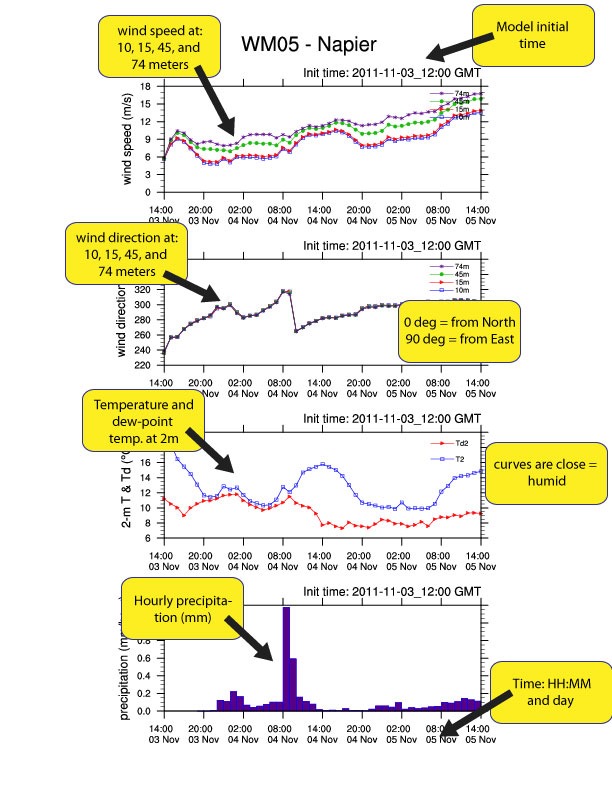
The verification tasks have shown that the WRF-based NWA gives excellent results at the 10 measurement mast locations. Not only are the annual mean wind speeds accurate but the distribution of the directions and wind speeds are also represented very well.

Within WASA, WRF it is used in an experimental mode to forecast wind speeds and directions over South Africa. Graphical representations of the fields generated by this model are presented in the links available at veaonline.risoe.dk
clip_image003

Verification is done against data from the 10 WASA met stations.

WRF models used by Windguru

Windguru is a service specialized in forecasting weather, mostly for windsurfers and kitesurfers but widely used by paragliding pilots in South Africa. Forecasts are based on data produced by weather forecast models including the aforementioned WRF models.

Windguru is running WRF model for most Europe and Mediterranean. South Africa, Canary Islands, Madeira and part of Morocco’s Atlantic coast are also covered by WRF with 9 km resolution. Another smaller WRF 9 km resolution domain covers Northern Red Sea with popular spots in Egypt, and also Israel, Lebannon and south of Cyprus. It also provides WRF 9 km forecasts for East Asia, this domain covers Japan, Korea, Taiwan and east China. Argentina, Chile and Uruguay are covered by WRF 12 km.

The initial and boundary conditions come from GFS. If everything goes smooth WRF updates 4 times per day and produce forecast for 78 hours to the future in 1 hour step.

Forecasts include wind speed and direction, wind gusts, temperature, total cloud cover and precipitation.

The highest resolution model we are running now is 3 km. Such a high resolution requires massive computing so the covered area can’t be very large. WRF with 3 km covers Czech republic, forecasts are for next 48 hours and update 4 times per day. Another small 3 km domain covers one of the most famous areas for wind & kitesurfing in Europe – Tarifa / Strait of Gibraltar.

There are 2 groups of forecast models available on Windguru, each with different availability to free and PRO users. WRF models including the WRF with 9 km resolution for South Africa are available for subscribers only but as we discussed before, the WASA project has found the distribution of the directions and wind speeds to represented very well in this model.

clip_image004[9]

Understanding the weather in South Africa – Part 1

image

At any time there are many weather systems weaving around the globe, however when averaged over many years a global pattern of air movement emerges.

The reason we have different weather patterns, jet streams, deserts and prevailing winds is all because of the global atmospheric circulation caused by the rotation of the Earth and the amount of heat different parts of the globe receive.

Over the major parts of the Earth’s surface there are large-scale wind circulations present. The global circulation can be described as the world-wide system of winds by which the necessary transport of heat from tropical to polar latitudes is accomplished. Global Circulations explain how air and storm systems travel over the Earth’s surface.

The earth’s tilt, rotation and land/sea distribution affect the global weather patterns we observe. While the weather varies from day-to-day at any particular location, over the years, the same type of weather will reoccur. The reoccurring “average weather” found in any particular place is called climate.

German climatologist and amateur botanist Wladimir Köppen (1846-1940) divided the world’s climates into categories based upon general temperature profile related to latitude. He worked with Rudolf Geiger to modify these categories which is known today as the Köppen-Geiger climate classification system.
Köppen was trained as a plant physiologist and realized that plants are indicators for many climatic elements. His effective classification was constructed on the basis of five vegetation groups determined by the French botanist De Candolle referring to the climate zones of the ancient Greeks. The five vegetation groups of Köppen distinguish between plants of the equatorial zone (A), the arid zone (B), the warm temperate zone (C), the snow zone (D) and the polar zone (E).

A second letter in the classification considers the precipitation (e.g. Df for snow and fully humid), a third letter the air temperature (e.g. Dfc for snow, fully humid with cool summer)

First letter

  • A – equatorial zone
  • B – arid zone
  • C – warm temperate zone
  • D – snow zone
  • E – polar zone

Second letter

  • f – wet year-round
  • s – dry summer season
  • w – dry winter season
  • m – monsoon

Third letter

  • a – hot summer
  • b – warm summer
  • c – cool summer
  • d – very cold winters

image

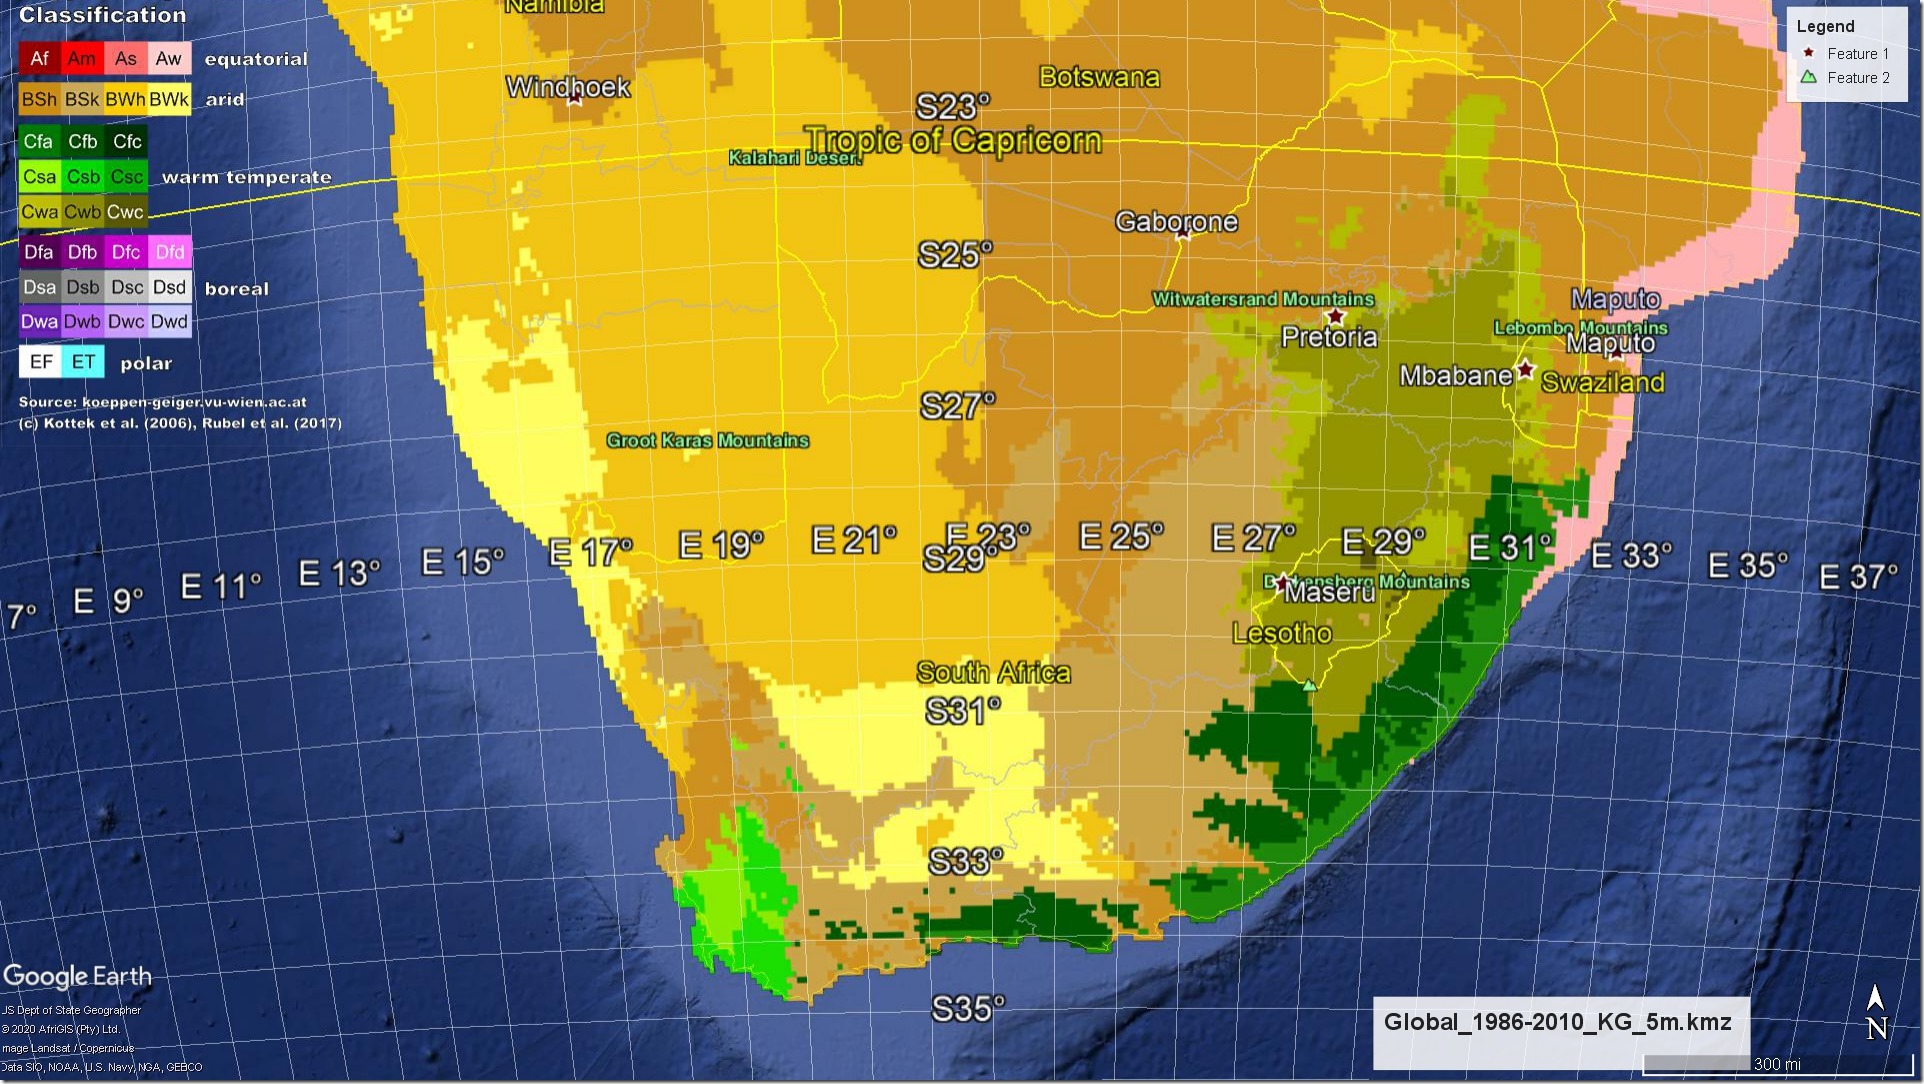
The climate of SA can be divided into three regions according to Koppen-Gieger climate classification with the climate zones shown in red, orange and green colors

  1. Equatorial savannah with dry winters
  2. Arid climates
  3. Warm temperate climates

clip_image001

Koppen-Gieger climate classification of South Africa representing different climatic regions (Source: – geiger.vu-wien.ac.at/)

Aw: Equatorial savannah with dry winter

Winter dry season. There are more than two months with less than 60mm of precipitation in winter.

Sodwana Bay, Tembe Elephant Safaris, Kosi Bay Rest Camp, Mabibi Campsite, Thonga Beach Lodge


BWk: Cold desert climate

Cold deserts have a mean annual temperature of less than 18 °C and no more than 200mm of precipitation annually.

Cold desert climates usually feature hot (or warm in a few instances), dry summers, though summers are not typically as hot as hot desert climates. Unlike hot desert climates, cold desert climates tend to feature cold, dry winters.

Beaufort West, Victoria West, Calvinia, Port Nolloth, Touws River


BWh: Hot deserts climate

Hot desert have a mean annual temperature of at least 18 °C and no more than 200mm of precipitation annually.

These climates usually feature hot, sometimes exceptionally hot, periods of the year. In many locations featuring a hot desert climate, maximum temperatures of over 40 °C (104 °F) are not uncommon in summer and can soar to over 45 °C (113 °F) in the hottest regions.

Klawer, Vredendal, Vanrhynsdorp, Musina, Keimoes


BSk: Cold semi-arid (steppe)

Steppe climates are intermediates between desert climates (BW) and humid climates in ecological characteristics and agricultural potential.

To determine if a location has a semi-arid climate, the precipitation threshold must first be determined. Finding the precipitation threshold (in millimeters) involves first multiplying the average annual temperature in °C by 20, then adding 280 if 70% or more of the total precipitation is in the high-sun half of the year (April through September in the Northern temperate zone, or October through March in the Southern), or 140 if 30%–70% of the total precipitation is received during the applicable period, or 0 if less than 30% of the total precipitation is so received. If the area’s annual precipitation is less than the threshold but more than half the threshold, it is classified as a BS (steppe climate).

Cold semi-arid climates have a mean annual temperature below 18°C, or a mean temperature of no more than 0°C in the coldest month.

Bloemfontein, Mossel Bay, New Bethesda, Jacobsbaai, Paternoster

BSh: Hot semi-arid (steppe)

Hot semi-arid climates have a mean annual temperature of at least 18°C, or a mean temperature greater than 0°C in the coldest month.

Madikwe Safari Lodge, Clanwilliam, White City, Saldanha, Uitenhage

Cfa: Humid subtropical

Temperate, without dry season, hot summer.

With the coldest month averaging above 0 °C (32 °F), at least one month’s average temperature above 22 °C (71.6 °F), and at least four months averaging above 10 °C (50 °F).

No significant precipitation difference between seasons. No dry months in the summer.

Durban, Pretoria, Kanyamazane, eMankayana, Matsulu

Cfb: Temperate oceanic

Temperate, without dry season, warm summer.

Coldest month averaging above 0 °C (32 °F), all months with average temperatures below 22 °C (71.6 °F), and at least four months averaging above 10 °C (50 °F).

No significant precipitation difference between seasons.

Johannesburg, Soweto, Port Elizabeth, Roodepoort, Krugersdorp


Csa: Hot-summer Mediterranean

Temperate, dry hot summer.

The coldest month averaging above 0 °C (32 °F), at least one month’s average temperature above 22 °C (71.6 °F), and at least four months averaging above 10 °C (50 °F).

At least three times as much precipitation in the wettest month of winter as in the driest month of summer, and driest month of summer receives less than 30 mm (1.2 in).

Klapmuts, Groot-Drakenstein, Simondium, Paarl, Windmeul

Csb: Warm-summer Mediterranean

Temperate, dry warm summer

The coldest month averaging above 0 °C (32 °F), all months with average temperatures below 22 °C (71.6 °F), and at least four months averaging above 10 °C (50 °F).

At least three times as much precipitation in the wettest month of winter as in the driest month of summer, and driest month of summer receives less than 30 mm (1.2 in).

Cape Town, Mitchells Plain, Blue Downs, Bellville, Elsiesrivier


Cwa: Monsoon-influenced humid subtropical

Temperate, dry winter, hot summer.

The coldest month averaging above 0 °C (32 °F), at least one month’s average temperature above 22 °C (71.6 °F), and at least four months averaging above 10 °C (50 °F).

At least ten times as much rain in the wettest month of summer as in the driest month of winter (an alternative definition is 70% or more of average annual precipitation is received in the warmest six months).

Ifafi, Makweti, Mothutlung, Mmakau, Mapetla

Cwb: Subtropical highland or temperate oceanic with dry winters

Temperate, dry winter, warm summer.

The coldest month averaging above 0 °C (32 °F), all months with average temperatures below 22 °C (71.6 °F), and at least four months averaging above 10 °C (50 °F).

At least ten times as much rain in the wettest month of summer as in the driest month of winter (an alternative definition is 70% or more of average annual precipitation received in the warmest six months).

Randburg, Irene, Alexandra, Sandton, Ermelo

clip_image001

clip_image001[9]

CWb: The Amphitheatre, Drakensberg Mountains (Uthukela District, KwaZulu-Natal, South Africa)

clip_image002

BSh: View of the old pit (Doornhoek Mine, Ngaka Modiri Molema District, North West, South Africa)

Geography of South Africa

South Africa is located at the southernmost region of Africa, with a long coastline that stretches more than 2,500 km and along two oceans: the South Atlantic and the Indian). At 1,219,912 km2, according to the UN Demographic Yearbook, South Africa is the 24th-largest country in the world. It is about the same size as Colombia, twice the size of France, three times as big as Japan, four times the size of Italy and five times the size of the United Kingdom.

Mafadi in the Drakensberg at 3,450 m is the highest peak in South Africa. Excluding the Prince Edward Islands, the country lies between latitudes 22° and 35°S, and longitudes 16° and 33°E.

The interior of South Africa consists of a vast, in most places almost flat, plateau with an altitude of between 1,000 m and 2,100 m, highest in the east and sloping gently downwards towards the west and north, and slightly less noticeably so to the south and south-west. This plateau is surrounded by the Great Escarpment whose eastern, and highest, stretch is known as the Drakensberg.

The south and south-western parts of the plateau (at approximately 1,100–1,800 m above sea level), and the adjoining plain below (at approximately 700–800 m above sea level) is known as the Great Karoo, which consists of sparsely populated scrubland.

To the north, the Great Karoo fades into the even drier and more arid Bushmanland, which eventually becomes the Kalahari desert in the very north-west of the country.

The mid-eastern, and highest part of the plateau is known as the Highveld. This relatively well-watered area is home to a great proportion of the country’s commercial farmlands and contains its largest conurbation (Gauteng). To the north of Highveld, from about the 25° 30′ S line of latitude, the plateau slopes downwards into the Bushveld, which ultimately gives way to the Limpopo lowlands or Lowveld.

clip_image001[5]clip_image002[6]

Prevailing macroclimatic conditions in South Africa

South Africa’s climatic conditions generally range from Mediterranean in the southwestern corner of South Africa to temperate in the interior plateau, and subtropical in the northeast. A small area in the northwest has a desert climate. Most of the country has warm, sunny days and cool nights. Rainfall generally occurs during summer (November through March), although in the southwest, around Cape Town, rainfall occurs in winter (June to August). Temperatures are influenced by variations in elevation, terrain, and ocean currents more than latitude.

Temperature and rainfall patterns vary in response to the movement of a high pressure belt that circles the globe between 25º and 30º south latitude during the winter and low-pressure systems that occur during summer. There is very little difference in average temperatures from south to north, however, in part because the inland plateau rises slightly in the northeast. For example, the average annual temperature in Cape Town is 17ºC, and in Pretoria, 17.5ºC, although these cities are separated by almost ten degrees of latitude. Maximum temperatures often exceed 32ºC in the summer, and reach 38ºC in some areas of the far north. The country’s highest recorded temperatures, close to 48ºC, have occurred in both the Northern Cape and Mpumalanga.

Frost occurs in high altitudes during the winter months. The coldest temperatures have been recorded about 250 kilometers northeast of Cape Town, where the average annual minimum temperature is -6.1º C. Record snowfalls (almost fifty centimeters) occurred in July 1994 in mountainous areas bordering Lesotho.

Climatic conditions vary noticeably between east and west, largely in response to the warm Agulhas ocean current, which sweeps southward along the Indian Ocean coastline in the east for several months of the year, and the cold Benguela current, which sweeps northward along the Atlantic Ocean coastline in the west. Air temperatures in Durban, on the Indian Ocean, average nearly 6º C warmer than temperatures at the same latitude on the Atlantic Ocean coast. The effects of these two currents can be seen even at the narrow peninsula of the Cape of Good Hope, where water temperatures average 4º C higher on the east side than on the west.

Rainfall varies considerably from west to east. In the northwest, annual rainfall often remains below 200 millimeters. Much of the eastern Highveld, in contrast, receives 500 millimeters to 900 millimeters of rainfall per year; occasionally, rainfall there exceeds 2,000 millimeters. A large area of the center of the country receives about 400 millimeters of rain, on average, and there are wide variations closer to the coast. The 400-millimeter “rainfall line” has been significant because land east of the rainfall line is generally suitable for growing crops, and land west of the rainfall line, only for livestock grazing or crop cultivation on irrigated land.

South African Weather By Province

Overall, the Western Cape climate is typically Mediterranean, with warm, dry summers and mild, moist winters and low summer rainfall prevail. Near the coast, summer’s temperature rises from a pleasant low of 15º C to a heartwarming 27º C. Inland temperatures are some 3-5º C higher. Coastal winters see the mercury dropping to a mild 7º C at night and rising to a comfortable 18º C by day. Away from the beach, morning wakens to an invigorating 5º C and midday peaks at 22º C.

The Garden Route region has a Mediterranean Maritime climate, with moderately hot summers, and mild to chilly winters. It is one of the richest rainfall areas in South Africa. Most of the rains occurs in the winter months, brought on by the humid sea-winds from the Indian ocean.

The coastal area of the Eastern Cape Province lies directly between the subtropical conditions of KwaZulu Natal and the Mediterranean conditions of the Western Cape, while its inland area is bisected by the great escarpment resulting in the southern reaches defined by a series of rivers and corresponding wetland fauna and flora, while the northern areas are those of the altitudinous plains of the Plateau and great Karoo. These topographical differences are what cause the climatic differences and conditions experienced by the towns and cities within these areas.

The climate in the KwaZulu Natal Province is all year ’round tourist friendly. Sea temperatures are also relatively stable, averaging 21 degrees all year, providing possibilities for a diversity of aquatic activities in any season, including diving, fishing, swimming, boating and surfing.

The Gauteng Climate is said to offer one of the world’s best climates: summer days are warm and wind free and winter days are crisp and clear. Johannesburg and Pretoria differ in temperature by about 2% (Pretoria being the warmer of the two).

Mpumalanga’s weather is naturally defined by its topography. Mpumalanga is a province of two halves, namely the high-lying grassland savannah of the highveld escarpment and the subtropical Lowveld plains. The western side of Mpumalanga, on the highveld escarpment, is like a rise of tropics, an ascent into an uncompromising range of temperatures. The west is drier, hotter and much colder than the rest of the Mpumalanga province.

Finding itself at South Africa’s northernmost area and bisected by the tropic of Capricorn, visitors to Limpopo can expect sunshine, long summer afternoons and dry days for most of their stay. Polokwane (previously known as Pietersburg), the capital city of Limpopo, lies more or less in the centre of the Limpopo province and its weather is reflective of most of it. Only the region east of the city offers markedly different climate, with most the subtropical conditions of the Lowveld providing weather more suited to dense forests.

Forming the southern part of the Kalahari Desert the North West Province offers almost year-round sunshine, making suntan lotion and a hat a prerequisite when visiting the North West Province, South Africa. The capital city, Mafikeng, enjoys weather indicative of largely the entire North West Province, with towns in the western areas only slightly hotter and those further south a bit cooler.

The Free State Province, with its vast beauty, endures a fair amount of hardship due to it’s hot, arid climate. Almost uniformly at about 1,300m above sea level, the Free State has weather typical of an interior plateau with summer rains, chilly winters and plenty of sunshine. To the north, the Vaal irrigation area nourishes the small assortment of farming towns below it, and the hue of the Free State countryside is often green.

Although the Northern Cape Province is mainly semi desert, the western areas of the Northern Cape, including Namaqualand, a small section of the Green Kalahari and Calvinia, Nieuwoudville and Loeriesfontein in the Upper Karoo fall into the winter rainfall area from April to September.

Best Paragliding Documentaries/Movies & Podcasts/Webcast

RedBull

The Rocky Mountains Traverse

Veteran paragliders Will Gadd and Gavin McClurg attempt to complete the first paragliding traverse of the Rocky Mountains range, North America‘s most iconic and wildest region. The 1,200km trek will be a world record flight if they make it.

North of Known

Gavin McClurg and Dave Turner take on the challenge of paragliding across the nearly 700km of the Alaska Range. Facing harsh weather, freezing temperatures and even starvation, it’s the most extreme vol-biv expedition ever attempted.

Ten Years of Red Bull X-Alps

Red Bull X-Alps is a two-week competition where pilots journey from Austria to Monaco by hiking up and flying over the Alps. From its humble beginnings to the 2013 event, this is the story of the most extreme endurance race in the world.

Red Bull X-Alps recap

Get the full recap from another incredible year of Red Bull X-Alps where athletes hike and fly over 1,000km from the mountains to the Mediterranean Sea.

Higher Ground – Paragliding in the Himalayas

Thomas de Dorlodot and Horacio Llorens journeyed for a personal adventure across the Himalayan mountains. They covered roughly 350km and became the very first paragliders to fly over Rohtang Pass.

Dare to Soar: Flying With Condors

After seeing the magnificent Andean condor ride thermal winds from the sea to the peaks of the Andes, paragliders Hernán Pitocco and Horacio Llorens try to follow the birds on their 3,000km ascent. However, sometimes flying high means falling hard.

The Unrideables: Alaska Range

Combining the fastest elements of both skiing and paragliding, speedriding is one of the most exciting winter sports in the world. Jon Devore and some of the most accomplished athletes in the sport want to tackle the ‘unrideable’ giants of Alaska.

inReach message from Javi Clayton

Back and safe at basecamp — De regreso y a salvo en el campamento base

View the location or send a reply to Javi Clayton: https://eur.inreach.garmin.com/textmessage/txtmsg?extId=5c2aedfa-acd2-4949-a2c2-c582f88581af&adr=cevo748yure%40post.wordpress.com

Javi Clayton sent this message from: Lat -1.471149 Lon -78.838298

Do not reply directly to this message.

This message was sent to you using the inReach two-way satellite communicator with GPS. To learn more, visit http://explore.garmin.com/inreach.